Article Text

Abstract
Aims: To prospectively determine the change in prevalence of microalbuminuria in relation to changes in glycaemic control in children diagnosed with type 1 diabetes between 1986 and 1996.
Design: Prospective observational study of an inception cohort.
Setting: The geographically defined region of Oxfordshire, UK.
Patients: 527 children diagnosed with type 1 diabetes under 16 years of age, were divided into three groups based on year of diagnosis of diabetes: group A (1986–1989, n = 165), group B (1990–1993, n = 179) and group C (1994–1996, n = 183). Each group was followed prospectively for 10 years.
Main outcome measures: Cumulative prevalence of microalbuminuria.
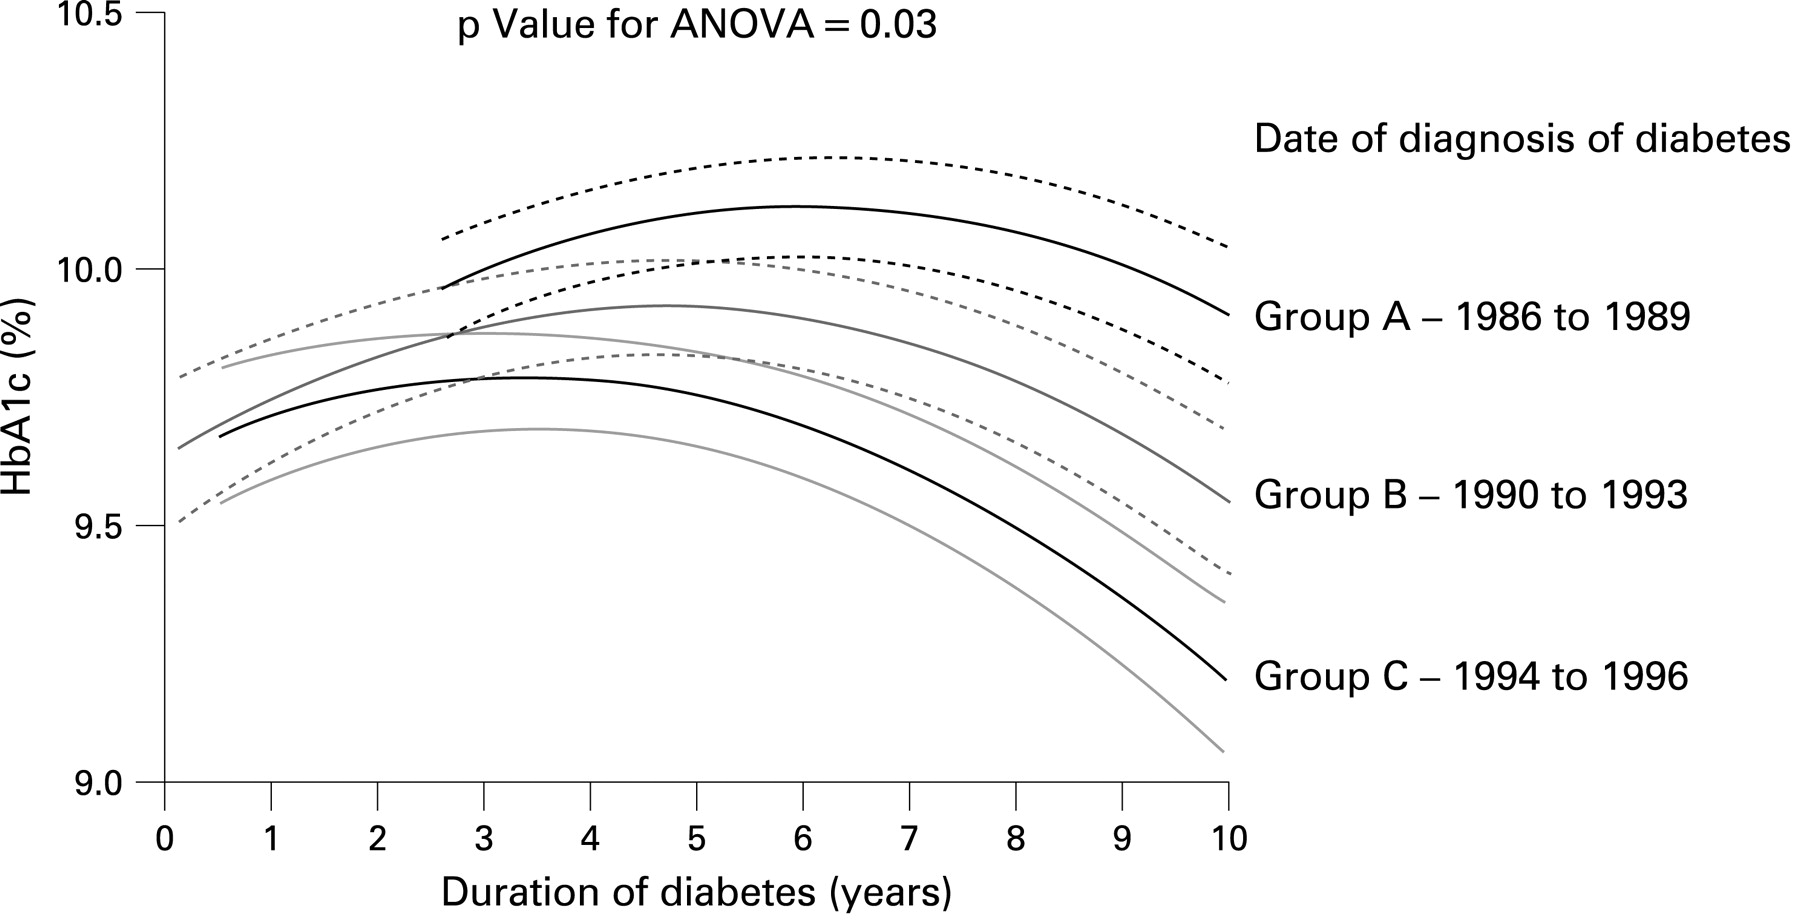
Results: After 4052 patient years of follow-up, in groups C versus B versus A, the cumulative prevalence of microalbuminuria was 31.7% (95% CI 20.9 to 42.5), 24.8% (17.8 to 31.8) and 23.2% (15.4 to 30.0) (log rank p = 0.22), and risk for development of microalbuminuria was not associated with year of onset of diabetes (hazard ratio 1.05 (0.99 to 1.12), p = 0.11). In groups C versus B versus A, glycaemic control improved after 10 years of diabetes (mean HbA1c 8.9% (1.5%) vs 9.4% (1.5%) vs 10.1% (1.7%), p value for ANOVA <0.001) and more children achieved an HbA1c level <7.5% (15.6% vs 5.9% vs 6.1%, p value for ANOVA = 0.032).
Conclusion: In this UK based inception cohort of children diagnosed with type 1 diabetes, the adjusted prevalence of microalbuminuria was unchanged since 1986, despite some improvements in glycaemic control. This observation highlights the need for more proactive intervention with drugs such as angiotensin converting enzyme (ACE) inhibitors.
Statistics from Altmetric.com
In adults with type 1 diabetes, the cumulative prevalence of microalbuminuria, an early marker for the development of diabetic nephropathy,1 is around 30%.2 Interventions to improve glycaemic control and lower blood pressure, and in particular the use of angiotensin converting enzyme (ACE) inhibitors reduce the risk for microalbuminuria3 4; consequently, observational studies have shown recent trends toward a reduced incidence of microalbuminuria.5
In those with childhood onset type 1 diabetes, the cumulative prevalence of microalbuminuria is greater than that observed in comparable adults cohorts after a similar duration of diabetes (51%6 vs 30%2 after approximately 20 years), whereas the prevalence of clinical proteinuria is similar (approximately 14%) but occurs at a much younger age.6 Data from childhood onset cohorts from Europe and Australia show trends toward a reduced incidence of microalbuminuria.7–9 However, one study was cross-sectional8 and all were clinic rather than population based studies. It is important to relate these observations to glycaemic control, the main modifiable risk factor for microalbuminuria. One study showed no improvement in HbA1c levels during follow-up,8 another showed improvement,9 while in the third study HbA1c levels were not reported.7
Reports of differences in HbA1c levels in different populations of children with type 1 diabetes reveal that achieving good control may involve as yet undetermined differences between centres. The Hvidore Study Group on Childhood Diabetes reported substantial differences in HbA1c levels between 22 European centres: some centres achieved excellent control, while others, particularly centres in the UK, had poor control with mean HbA1c levels above 9.2%.10 The reasons for these differences were unclear and are not completely explained by frequency of intensive insulin therapy use, diet and social differences.11 Consistent with these observations, data from the UK National Diabetes Audit 2004/5 showed that only 16% of children were achieving the national target of an HbA1c level of less than 7.5%.12
The aim of our study was to evaluate changes in microalbuminuria prevalence in relation to glycaemic control, in an inception cohort of UK based subjects with childhood onset type 1 diabetes recruited between 1986 and 1996 and followed for 10 years.
METHODS
The Oxford Regional Prospective Study (ORPS) cohort
The ORPS cohort was established in 1986.13 Children aged less than 16 years in the Oxford Health Authority area in the UK were identified over a 10-year period from the St Bartholomew’s-Oxford diabetes register and were recruited within 3 months of diagnosis of diabetes. Case ascertainment for the register has been verified to be over 95%.14 In total, 91% (n = 527) of eligible subjects were recruited between 1986 and 1997 at a mean age of 8.8 (SD 4.0) years. The dropout rate to date is 9.6%. Ethics approval was obtained from district ethics committees, written consent from parents and verbal assent from children. Only 4% of the cohort has had less than 3 years of follow-up, while 9% have greater than 15 years of follow-up. In agreement with individual physicians, microalbuminuria was treated with ACE inhibitors or β-blockers if the subject was more than 18 years old and microalbuminuria was persistent or accompanied by hypertension.
For the purpose of this investigation, the cohort was divided into three groups based on the year of onset of type 1 diabetes: group A, 1986–1989 (n = 165); group B, 1990–1993 (n = 179) and group C, 1994–1996 (n = 183). Each group was followed prospectively for a mean of 10 (SD 3.6) years. We grouped the participants into three cohorts (rather than analyse date of diagnosis as a continuous variable) in order to allow comparison with previously published data,8 where similar analyses were used.
Annual assessments
Subjects were assessed annually from the first year of diagnosis for height, weight and blood pressure and three consecutive early morning (first void) urine specimens were collected for the measurement of albumin:creatinine ratio (ACR). Blood samples were collected for centralised measurement of HbA1c.
Definition of microalbuminuria
Microalbuminuria was defined as an ACR of 3.5–35 mg/mmol in males and 4.0–47 mg/mmol in females in two out of three consecutive early morning urine collections during the annual assessment. This corresponded to an albumin excretion rate of 20–200 μg/min, based on linear regression equations giving the relationship between ACR and albumin excretion rate measure in 304 timed overnight urine collections in a subgroup of patients.13 Three urine samples were collected in 84% of all annual assessments and two samples were collected in 16%. Where only two urine samples were obtained, both had to be above the threshold to define microalbuminuria.
Albumin assay
Until 1994 urine samples were stored at −20°C and after this at −70°C. Albumin was measured centrally by a double antibody ELISA method. The within and in-between assay coefficients of variation (CV) were 6% and 12%, respectively.
Creatinine
Creatinine was measured using a modified Jaffe method (Unimate 7, Roche Diagnostic Systems, Basel, Switzerland) on a Cobas Mira (Roche Diagnostic Systems) automated spectrophotometer. The CV was 2% at 2.2 mmol/l.
HbA1c
Glycated haemoglobin was centrally measured initially by an electrophoretic method (Ciba Corning Diagnostics, Halstead, UK) and then by high performance liquid chromatography (DIAMAT; Bio-Rad, Hemel Hempstead, UK). The relationship between the two methods was carefully evaluated and has been described previously.13 The within-batch CV for the HPLC method was 2.2% and 1.3% at a level of 9.8% and 10.1%, respectively. The between-batch CV was 3.5% and 2.2% at 5.6% and 10.1%, respectively. The normal range was 4.3% to 6.0%.
Statistical methods
As excretion of urinary albumin varies greatly within individuals and three consecutive measurements tend not to be normally distributed, we averaged three results from each subject with the geometric mean. The distributions of these yearly geometric means for the whole cohort were not normally distributed and were log transformed and analysed on this scale. This geometric mean from three samples was used for the annual urine result irrespective of the pre-defined microalbuminuria status. Other data were normally distributed. For each subject, data were summarised as means and data from the three groups (according to date of diagnosis of diabetes) were compared using an ANOVA model and χ2 analyses. In addition, the independent t test and χ2 analyses were used to compare data from those with and without microalbuminuria. A life table method was used to calculate the cumulative prevalence of microalbuminuria after 10 years of diabetes. An ANOVA model was also used to compare adjusted measures of association with log urine ACR.
To display longitudinal changes in urine HbA1c levels, we used multilevel modelling software (MLwiN v 1.0 beta, Institute of Education, London, UK). This is a hierarchical regression model, allowing consideration of an individual’s longitudinal data and summation by predefined groups. Variance in HbA1c was modelled against duration of diabetes. To recognise longitudinal HbA1c levels for each child, two levels of hierarchy in the data were used: level 1 consisted of all measurement points, and level 2 consisted of unique codes for each child. Models with the categorical explanatory variable (date of diagnosis of diabetes – three groups) were built separately, and from these models graphs of the predicted values were drawn. A model was estimated separately for each of the three groups, and from these models we obtained a graph of the curves of mean predicted values over time in each group and standard errors of the mean. Each model was a hierarchical random-effects model, with level 1 of the data hierarchy being the measurement points nested within child as level 2, thereby allowing for the repeated measurements per child. HbA1c was modelled against diabetes duration using linear, quadratic and cubic terms and from these parameters we drew graphs of the mean (±standard error of the mean) predicted values over time in each group. SPSS v 11.5 was used for the remainder of the statistical analyses and a p value <0.05 was considered significant. Data are shown as mean (SD) unless otherwise stated.
RESULTS
Characteristics of subjects with microalbuminuria
After 10 years of diabetes and 4052 patient years of follow-up of 527 subjects, 110 patients developed microalbuminuria (20.9%). The mean age of onset of microalbuminuria was 15.2 (3.9) years after 5.8 (2.7) years of diabetes. In subjects with microalbuminuria compared to those with normoalbuminuria, there were no differences in age at diagnosis of diabetes (9.4 (95% CI 1.1 to 15.9) vs 8.7 (0.4 to 15.7) years, p = 0.11), current duration of diabetes (9.8 (2.9 to 18.6) vs 9.8 (0.9 to 19.2) years, p = 0.99) or current age (19.2 (8.4 to 28.6) vs 18.5 5.7 to 31.8) years, p = 0.14). Frequency of smoking history was no different (n = 32 (33.3%) vs n = 103 (25.0%), χ2 = 2.8, p = 0.10).
Development of microalbuminuria in relation to date of diagnosis of diabetes
The cumulative prevalence of microalbuminuria was no different between groups A (date of diagnosis 1986–1989), B (1990–1993) and C (1994–1996) (table 1 and fig 1). Microalbuminuria was not associated with year of onset of type 1 diabetes (hazard ratio 1.05 (0.99 to 1.12), p = 0.11, after adjusting for known risk factors). Potential problems may arise if participants with a urine ACR near the lower limit of definition for microalbuminuria cross this level because of random measurement error or regression to the mean. Therefore, to improve sensitivity, we used an alternative cut-off for the definition of microalbuminuria. By reducing the lower limit by 0.5 mg/mmol, 119 subjects met the criteria for microalbuminuria, but there was no difference in prevalence between the groups: group A, n = 36 (21.9%); group B, n = 41 (22.9%); and group C, n = 42 (22.7%); χ2 = 0.4, p = 0.97. Similarly by reducing the lower limit for the definition of microalbuminuria by 1.0 mg/mmol, 129 subjects met the criteria for microalbuminuria but there remained no difference between the groups: group A, n = 36 (21.9%); group B, n = 45 (25.1%); and group C, n = 48 (25.9%); χ2 = 1.1, p = 0.66. For further confirmation of these findings, in an ANOVA model, log urine ACR was not associated with date of diagnosis of diabetes (F = 1.92, p = 0.15) after adjusting for known risk factors.
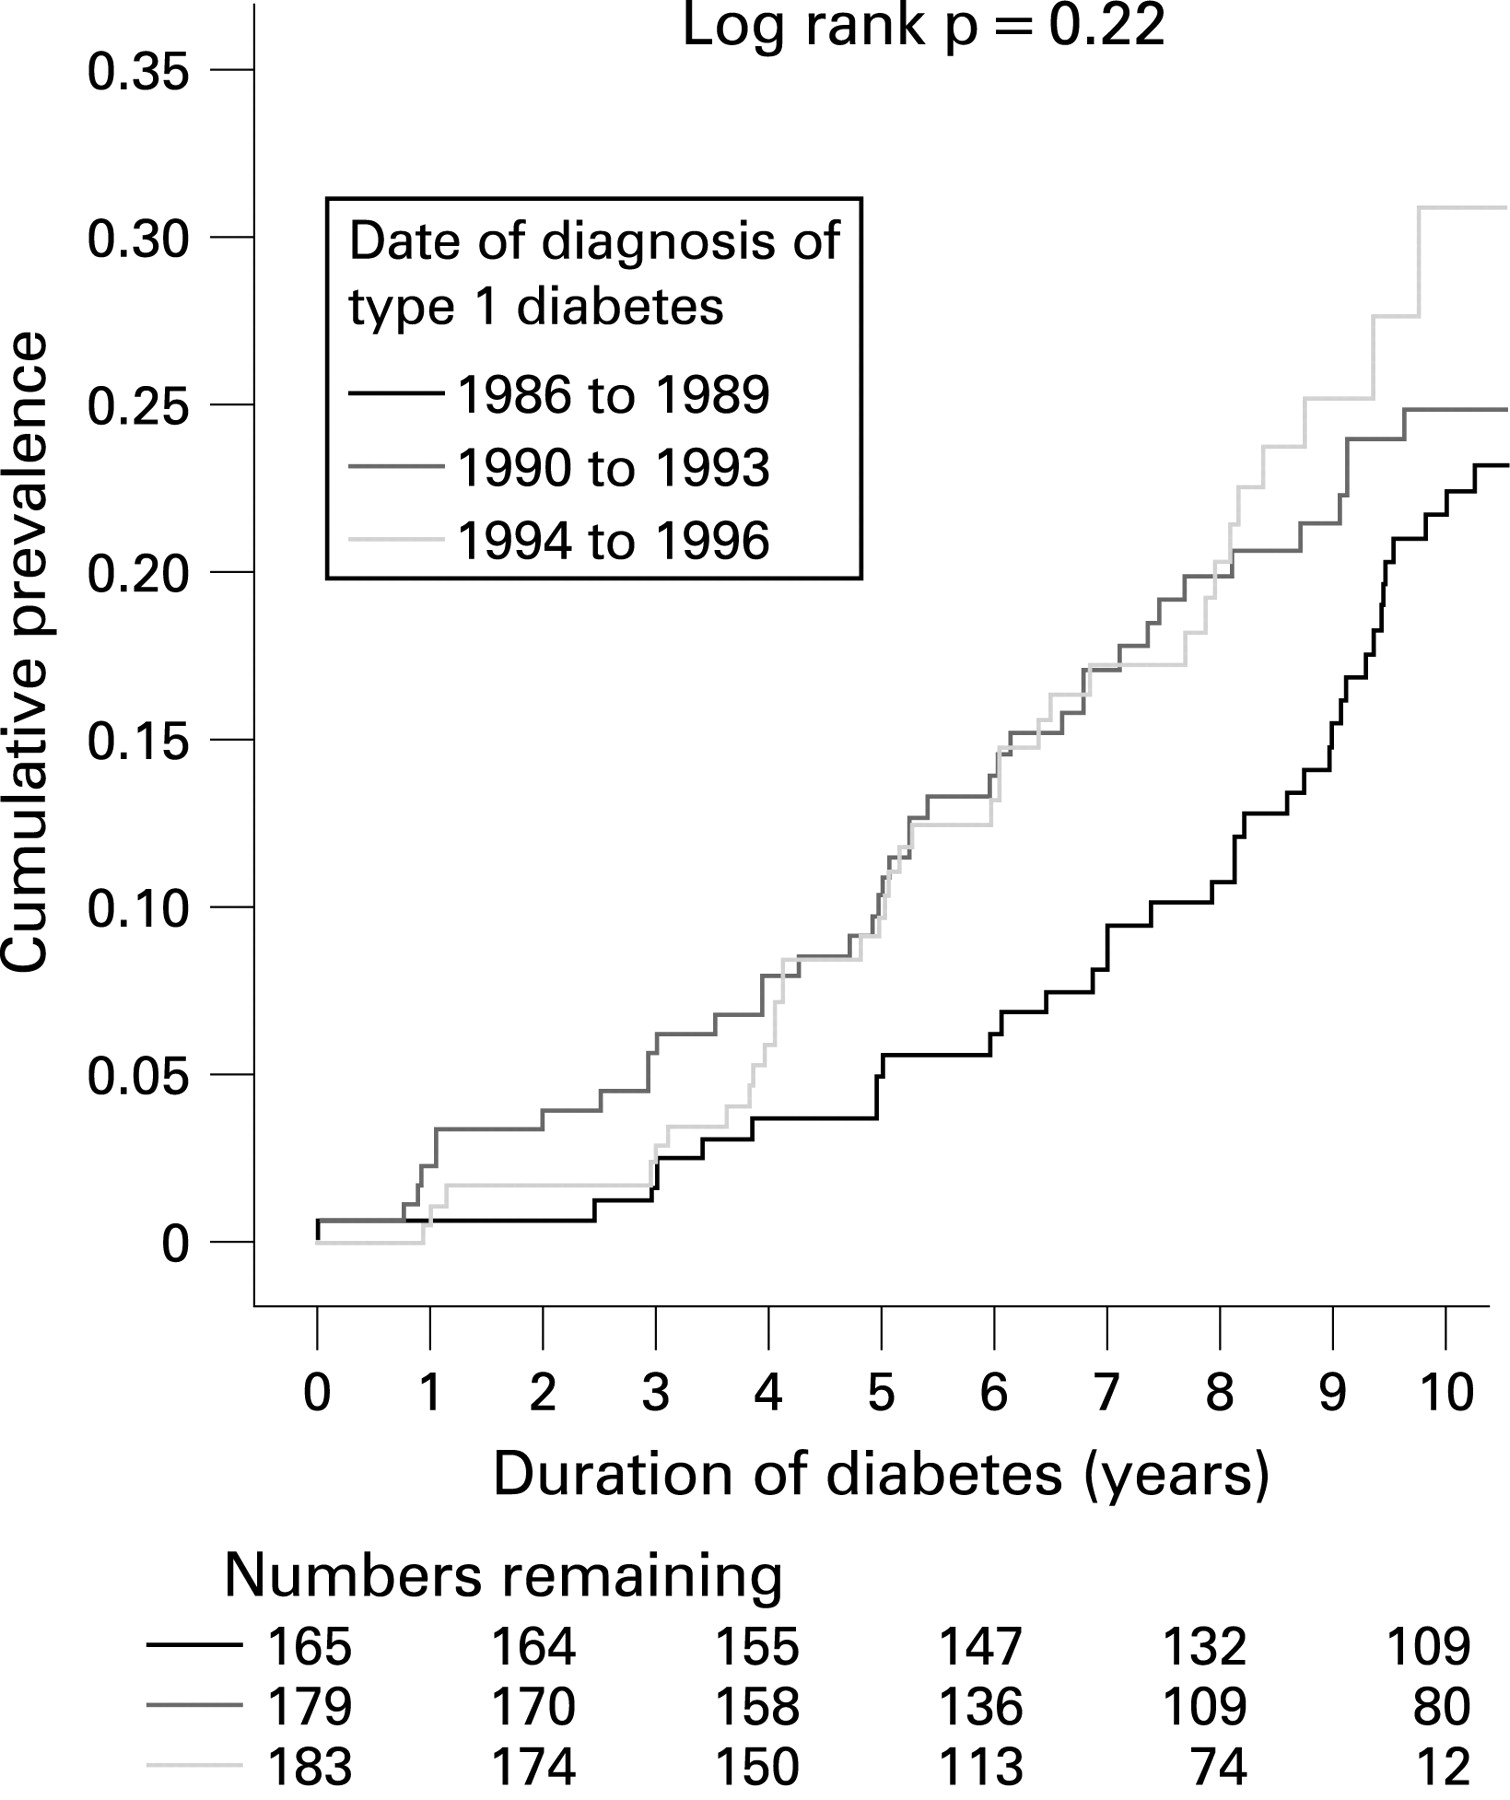
Kaplan–Meier survival curve showing the cumulative prevalence of developing microalbuminuria (110 events) in 527 patients with childhood onset type 1 diabetes after 10 years of diabetes, in relation to year of diabetes onset.
Effects of glycaemic control
Although overall glycaemic control was poor, for all three groups there was a trend towards lower HbA1c levels over time, particularly in group C (table 1 and fig 2). After 10 years of diabetes, mean HbA1c levels were highest in group A and lowest in group C (table 1). Similarly the percentage of subjects with yearly HbA1c levels less than 9% and less than 7.5% after 10 years of diabetes was greatest in group C and lowest in group A (group C vs B vs A: HbA1c<9%, 58.4% vs 45.5% vs 29.5%, χ2 = 7.9, p<0.001 and HbA1c<7.5%, 15.6% vs 5.9% vs 6.1%, χ2 = 7.9, p = 0.032) (fig 3). Of note, the greater percentage of subjects achieving an HbA1c of <7.5% in group C was only apparent in the final year of follow-up (fig 3).

Yearly mean HbA1c levels in 527 subjects with childhood onset type 1 diabetes, in relation to date of diagnosis of diabetes. Figures were derived from multilevel modelling (MLwiN v 1.0 beta, Institute of Education, UK). Dotted lines represent ±standard error of the mean.

Percentage with yearly HbA1c levels <7.5% during the first 10 years of diabetes in 527 subjects with childhood onset type 1 diabetes, in relation to date of diagnosis of diabetes.
In subjects with microalbuminuria compared to those with normoalbuminuria, mean HbA1c levels were higher (10.7% (1.7%) vs 9.6% (1.5%), p<0.001) and the percentage of subjects with a yearly HbA1c level <7.5% was lower after 10 years of diabetes (6.4% vs 11.8%, χ2 = 3.9, p = 0.047).
Intervention with anti-hypertensive medication
Only 20 (15%) subjects with microalbuminuria were started on ACE inhibitors or β-blockers for either persistent microalbuminuria and/or hypertension. Age at start of medication was 20.8 (4.1) years and median duration of diabetes was 11.2 (3.5) years. There was no statistical difference in HbA1c levels between subjects with microalbuminuria on medication compared to subjects with microalbuminuria but not on medication.
DISCUSSION
We report changes in the prevalence of microalbuminuria in relation to trends in glycaemic control over the previous 20 years in a large UK based, inception cohort of patients with childhood onset type 1 diabetes. The overall cumulative prevalence of microalbuminuria in our cohort is greater than previously reported in longitudinal childhood studies,15–17 but these previous studies were clinic based with variable diabetes duration at inclusion when compared with the current cohort, where all subjects were recruited at diagnosis and case ascertainment was high with low dropout rates, indicating that observations from ORPS are an unbiased representation of care for childhood diabetes in the UK.6
The unchanged prevalence of microalbuminuria in our cohort over the last 20 years is in contrast with recent data from childhood onset cohorts from Sweden and Australia which showed a lower overall prevalence of microalbuminuria and significant trends toward reduced incidence in recent years.7–9 However, both these cohorts were clinic rather than population based, and case ascertainment was not reported. In addition, the Swedish definition of microalbuminuria was based initially on the urine dipstick test for proteinuria and subsequently on timed or spot collections of urine, with analysis of urine samples undertaken at numerous sites.7 9 In the Australian study, the definition of microalbuminuria was similar to that in our cohort, using three consecutive timed overnight collections of urine, but data were cross-sectional.8
If a true difference exists between these three international cohorts in changes in incidence of microalbuminuria, then this may relate to differences in glycaemic control, the most important modifiable risk factor for microalbuminuria.8 The overall mean HbA1c level for the Australian cohort was 8.6%, for the Swedish cohort 7.1%, and our cohort 9.7%. All three studies used the HPLC method for measuring HbA1c for the majority of the study periods; however, laboratories in Sweden give, on average, readings 1% lower than in the Diabetic Control and Complications Trial.18 Even allowing for differences in assay, these variable HbA1c levels are in keeping with data from the Hvidore Study Group on Childhood Diabetes, which found substantial differences in central measurement of HbA1c levels in 22 European centres, with particularly poor control in the UK.10 These observations may relate to differences in factors such as communication, family structure and the medicalisation of adolescence within the medical culture.11
The observed differences in glycaemic control between European centres may also reflect differing medical practice, as for example, it is estimated that up to 20% of children with type 1 diabetes in Sweden are using insulin pump therapy.19 In the UK, estimates of pump use are much lower, although the use of basal bolus regimes and pump use in the ORPS cohort may have increased during the 10-year follow-up period of our study. However, importantly, the Hvidore Study Group showed no improvement in HbA1c levels with increased frequency of intensification therapy.20 Although there are other reports of improved glycaemic control in children using insulin pump therapy,21 22 only a single randomised controlled trial exists,23 which was underpowered and found at the end of follow-up (only 12 months) that no difference existed in glycaemic control between those using insulin pump therapy and those on a basal bolus insulin regimen.
In our study, despite improvements in glycaemic control and numbers of subjects achieving HbA1c targets, the prevalence of microalbuminuria was unaffected, even when sensitivity analyses were evaluated using a lower cut-off level for the definition of microalbuminuria. Collectively these data add further weight to the growing body of evidence indicating that factors other than glycaemic control may be important in the pathogenesis of microalbuminuria during adolescence.24 25 Non-modifiable predictors of microalbuminuria in childhood include puberty and female sex,13 indicating that pubertal hormonal changes occurring in adolescents with type 1 diabetes may play a role. Consistent with this hypothesis, some experimental and clinical data have implicated changes in the growth hormone axis and also sex steroids in the development of pathogenic features characteristic of microalbuminuria, namely nephromegaly, glomerular hyperfiltration and basement membrane abnormalities.26 27 A further complexity is that the development of diabetic nephropathy in type 1 diabetes maybe associated with familial risk for the development of type 2 diabetes,28 indicating the co-existence of an inherited insulin resistant component in the pathogenesis of microalbuminuria.
What is already known on this topic
Microalbuminuria is predictive of diabetic nephropathy and prevalence is greater in subjects with childhood onset compared with adult onset type 1 diabetes.
Reduced prevalence of microalbuminuria has been reported in non-UK based cohorts.
What this study adds
In the UK, the prevalence of microalbuminuria in childhood onset type 1 diabetes has been unchanged since 1986.
There are trends towards improvements in HbA1c levels, although overall glycaemic control still remains poor and national targets are not being achieved.
These data implicating other non-glycaemic genetic and environmental risk factors during adolescence suggest a more pragmatic approach to the prevention of microvascular complications should be considered. Intervention with ACE inhibitors in diabetic adults with microalbuminuria reduces the risk of progression to clinical proteinuria.4 For adolescents aged between 11 and 15 years of age, albumin excretion in the highest tertile of the normal range predicts 85% of subjects who go on to develop microalbuminuria and all of the subjects who develop clinical proteinuria.29 This together with the continued high incidence of microalbuminuria in the UK indicates that early renoprotection during puberty to prevent long term complications may be warranted. However, the decision to treat may be complicated as recent robust data from our group indicate that microalbuminuria is transient in 39% of cases,6 and only further follow-up will reveal whether there is later recurrence. In addition, factors such as compliance with long term therapy and unplanned pregnancies would need to be considered carefully. Although small reports show the likely efficacy of ACE inhibitors in adolescents,30–32 there is a need for a formal long term randomised controlled trial in this age group.
To conclude, the prognosis for childhood onset type 1 diabetes remains generally poor6 and the number of life years lost has remained unchanged over the last four decades.33 Consistent with these data, our UK based inception cohort of patients with childhood diabetes shows no change in the prevalence of microalbuminuria since 1986. This is despite a general improvement in glycaemic control, although only a minority of subjects are achieving national targets for HbA1c levels. A pragmatic rethink in strategies for earlier intervention to reduce urine albumin excretion is required in this age group.
Acknowledgments
We acknowledge The Juvenile Diabetes Research Foundation, the study field workers, the laboratory assistance of Angie Watts and Dot Harris, the Barts-Oxford Study field workers, paediatricians, physicians and diabetes nurse specialists in the Oxford region. Members of the Oxford Regional Prospective Study Steering Committee are: DB Dunger, RN Dalton, J Fuller, EAM Gale, H Keen, M Murphy, HAW Niel, RJ Young and T Konopelska-Bahu. Members of the Oxford Regional Prospective Study are: J Edge, John Radcliffe Hospital, Oxford; HAW Neil and D Matthews, The Oxford Centre for Diabetes, Endocrinology and Metabolism, The Churchill Hospital, Oxford; RAF Bell and A Taylor, Horton General Hospital, Banbury; A Mukhtar, BP O’Malley, BR Silk and EH Smith, Kettering District Hospital, Kettering; RDM Scott, King Edward VII Hospital, Windsor; FM Ackland, CJ Fox and NK Griffin, Northampton General Hospital, Northampton; N Mann, H Simpson, P Cove Smith and M Pollitzer, Royal Berkshire Hospital, Reading; RS Brown and AH Knight, Stoke Mandeville Hospital, Aylesbury; JM Cowen and JC Pearce, Wexham Park Hospital, Slough.
REFERENCES
Footnotes
Funding: The Oxford Regional Prospective Study is funded by Diabetes UK.
Competing interests: None.
Ethics approval: Ethics approval was obtained from district ethics committees.