Article Text

Abstract
Objectives The aim of this study is to explore different methods for screening and diagnosing hypertension—which definitions and criteria to use—in children and in addition to determine the prevalence of hypertension in Dutch overweight children.
Design A cross-sectional study performed in the Dutch Child Health Care setting.
Setting Four Child Health Care centres in different cities in the Netherlands.
Participants 969 overweight (including obese) and 438 non-overweight children, median age 11.7 years (range 4.1–17.10), 49% boys.
Main outcome measures The main outcome was blood pressure, and the difference in prevalence of hypertension using different criteria for blood pressure interpretation: using the first blood pressure measurement, the mean of two measurements and the lowest of three measurements on two different occasions.
Results Looking at the first measurement alone, 33% of overweight and 21% of non-overweight children had hypertension. By comparing the mean of the first two measurements with reference values, 28% of overweight children and 16% of non-overweight children had hypertension. Based on the lowest of three consecutive measurements, the prevalence decreased to 12% among overweight children and 5% among non-overweight children at visit one and at visit two 4% of overweight children still had hypertension.
Conclusions The prevalence of hypertension is highly dependent on the definitions and criteria used. We found a prevalence of 4% in overweight children, which is considerably lower than suggested by recent literature (4%–33%). This discrepancy can be explained by our more strict definition of hypertension. However, to draw any conclusions on the prevalence, normal values using the same definition of hypertension should be established. Despite the low prevalence, we recommend measuring blood pressure in all overweight children in view of later cardiovascular morbidity and mortality.
- Hypertension
- Obesity
- Children
- Screening
Statistics from Altmetric.com
What is already known on this topic
Due to a high prevalence of hypertension in overweight and obese children, it is often recommended to screen overweight children for hypertension.
To determine the prevalence of hypertension in children, most studies compare the first or the mean of two measurements on one occasion to reference values.
What this study adds
The prevalence of hypertension is highly dependent on the manner in which blood pressure is interpreted, and which definitions and criteria for hypertension are used.
We compared the lowest of three blood pressure measurements on two occasions with reference values, instead of the first or mean of two measurements on one occasion.
With our method of measuring, the prevalence of hypertension in overweight and obese children drops from 33%–28% to 4.4%.
Introduction
In parallel with the increase in obesity, hypertension is progressively diagnosed in children and adolescents. An association between hypertension and overweight and obesity in children has been found in many studies, with a prevalence of hypertension ranging from 4%–14% in overweight children to 11%–33% in obese children.1–6 Overweight and obesity are currently the number one cause of childhood hypertension.7 In addition, since obesity and hypertension have the tendency to track from childhood into adulthood, the burden of hypertension in adults will rise.8 ,9 Childhood hypertension can lead to atherosclerosis in young adulthood,10–12 which in turn can lead to cardiovascular morbidity and mortality and to renal damage.13 Consequently, it is important that hypertension is timely identified and treated.
In the Netherlands, the national public health service Child Health Care reaches 95% of all children at different ages, thereby providing a unique setting for prevention and screening. Child Health Care offers voluntary systematic medical examinations in which it tracks weight, height and psychomotor development of children at the ages of 0–4 years and at the age of 5, 10, 14 and 16 years. Child Health Care works in close collaboration with schools, inviting children through schools and often screening children at school.14
Based on literature review, the recently installed Dutch ‘Guideline overweight for Child Health Care’ recommends screening overweight children from the age of 5 for hypertension to prevent cardiovascular morbidity and kidney damage.15 The aim of this study is to explore different methods for screening and diagnosing hypertension—which definitions and criteria to use—in children and in addition to determine the prevalence of hypertension in Dutch overweight children.
Methods
General outline of the study
The study had a cross-sectional design. Four Child Health Care organisations, recruited via an advertisement on the website of the Dutch centre for Child Health Care and selected based on order of response, participated in the study. All children aged 5–17 years who were called in for a regular health check-up from September 2013 until July 2014 were invited to participate in the study, until the target numbers of 1000 overweight and 400 non-overweight children were reached. Children attending a special education programme (children with learning and behavioural difficulties) were excluded because of the possible coexistence of syndromes or conditions affecting blood pressure (BP), as well as children who are known to have a medical condition or receive medication affecting BP.
The study has been approved by the VU University Medical Ethical Committee.
Anthropometric and BP measurements
Child Health Care professionals, physicians, nurses and assistants working for the four organisations performed the anthropometric and BP measurements during the regular health check-up. The professionals underwent a training organised by the researchers prior to the start of the study, to ensure that all measurements were standardised. Height was measured to the nearest 0.1 cm using a stadiometer. Body weight was measured to the nearest 0.1 kg using a digital scale, with children barefooted and preferably wearing only light clothing. Body mass index (BMI) was calculated as weight in kilograms divided by the square of body height in metres and categorised according to the International Obesity Task Force.16
BP was measured at the right arm using an electronic oscillometric BP monitor (Omron M6, Omron Healthcare Co, Kyoto, Japan), after a 5 min rest period. The appropriate size cuff was used, that is, the width of the inflatable bladder covering at least 40% of the circumference of the upper arm and the bladder length at least 80% of the circumference of the arm.17 Three consecutive measurements were taken, and the lowest value was compared with cut-off points provided by the American National High Blood Pressure Education Programme (NHBPEP) Working Group on Children and Adolescents.17 If systolic or diastolic BP values equalled or exceeded the 95th percentile cut-off value, children were asked to return within 6 weeks for additional three measurements. If at the second visit BP was still ≥95th percentile, the child was referred to the general practitioner or paediatrician to verify the diagnosis of hypertension.
Definitions
Overweight was defined as a BMI corresponding to an adult BMI≥25 kg/m2, obesity as BMI≥30 kg/m2 and morbid obesity as a BMI≥35 kg/m2, according to the definitions of the International Obesity Task Force.16 Hypertension was defined as BP≥95th percentile and prehypertension as BP≥90th, and <95th percentile for age, gender and height, according to the NHBPEP Working Group on Children and Adolescents,17 and, according to our definition, based on the lowest value of three measurements on two separate occasions. Ethnicity of children was defined as country of birth of the mother, unless the mother was born in the Netherlands and the father was born elsewhere, in which case country of birth of the father was used. Ethnicity was categorised as ‘Western’—including countries in Europe (Turkey excluded), North America or Oceania—or as ‘non-Western’—including countries in Africa, Latin America, Asia or Turkey. Age groups were created, categorised based on the standard contact moment of Dutch Child Health Care system.
Statistical analysis
Differences in characteristics between overweight and non-overweight children were tested with χ2 tests. BMI and height SD scores (SDS) were calculated using the LMS method,16 with, respectively, WHO18 and Centers for Disease Control and Prevention data.19 BP SDS were calculated using the equations provided by the NHBPEP Working Group on Children and Adolescents.17 All analyses with BP are performed on the SDS-BP scores. A level of p<0.05 was considered significant. The statistical analyses were performed with SPSS software V.22.0 (SPSS, Chicago, Illinois, USA).
Results
A total of 1407 children—969 (69%) overweight children, including obese children, and 438 (31%) non-overweight children—were included in the study. Demographic, anthropometric and BP data are presented according to weight status in table 1.
Characteristics of the study sample according to weight status, at the first visit
BP levels were significantly higher in overweight children compared with non-overweight children (mean SDS at first visit 0.91±0.97 vs 0.46±0.88, p=0.001), table 1. Table 2 shows the mean systolic and diastolic BP values of the three measurements, as well as the SDS values, for overweight and non-overweight children. BP values were highest at the first measurement and lowest at the third measurement at the same visit.
BP measurements
The reference values provided by the NHBPEP Working Group are created based on the pooling of the first BP measurement values of several cohort studies in children.20 When examining the first BP measurement only, 32.5% of overweight and 21.2% of non-overweight children had hypertension. Consequently, the prevalence of hypertension in overweight as well as in non-overweight children is high.
When comparing the average of the first two measurements at visit one with the cut-off values, as many studies do, 28.1% of overweight children and 15.8% of non-overweight children had a BP≥95th percentile at the first visit.
Using our method, comparing the lowest value of three measurements with the cut-off values (at two occasions), 12.4% of overweight children had a BP≥95th percentile at the first visit, and 4.4% still had hypertension at the second visit. However, 17 children did not show up at the second visit. If they all had hypertension, the prevalence would be 6.1%. Hence, the prevalence in this sample of overweight children is between 4.4% and 6.1%. Of the non-overweight children, 4.6% had a BP≥95th percentile at the first visit, and 0.2% still had hypertension at the second visit. Table 3 shows a comparison between the results of the different definitions for hypertension used. Table 4 shows the characteristics of overweight children with a BP≥95th percentile at the first and second visit, using the lowest value of three measurements.
Prevalence of high BP (≥P95) according to different criteria
Characteristics of overweight children with BP≥P95 at the first and second visit
Figure 1 displays a flowchart of the process of BP measurements and referral of the overweight children.
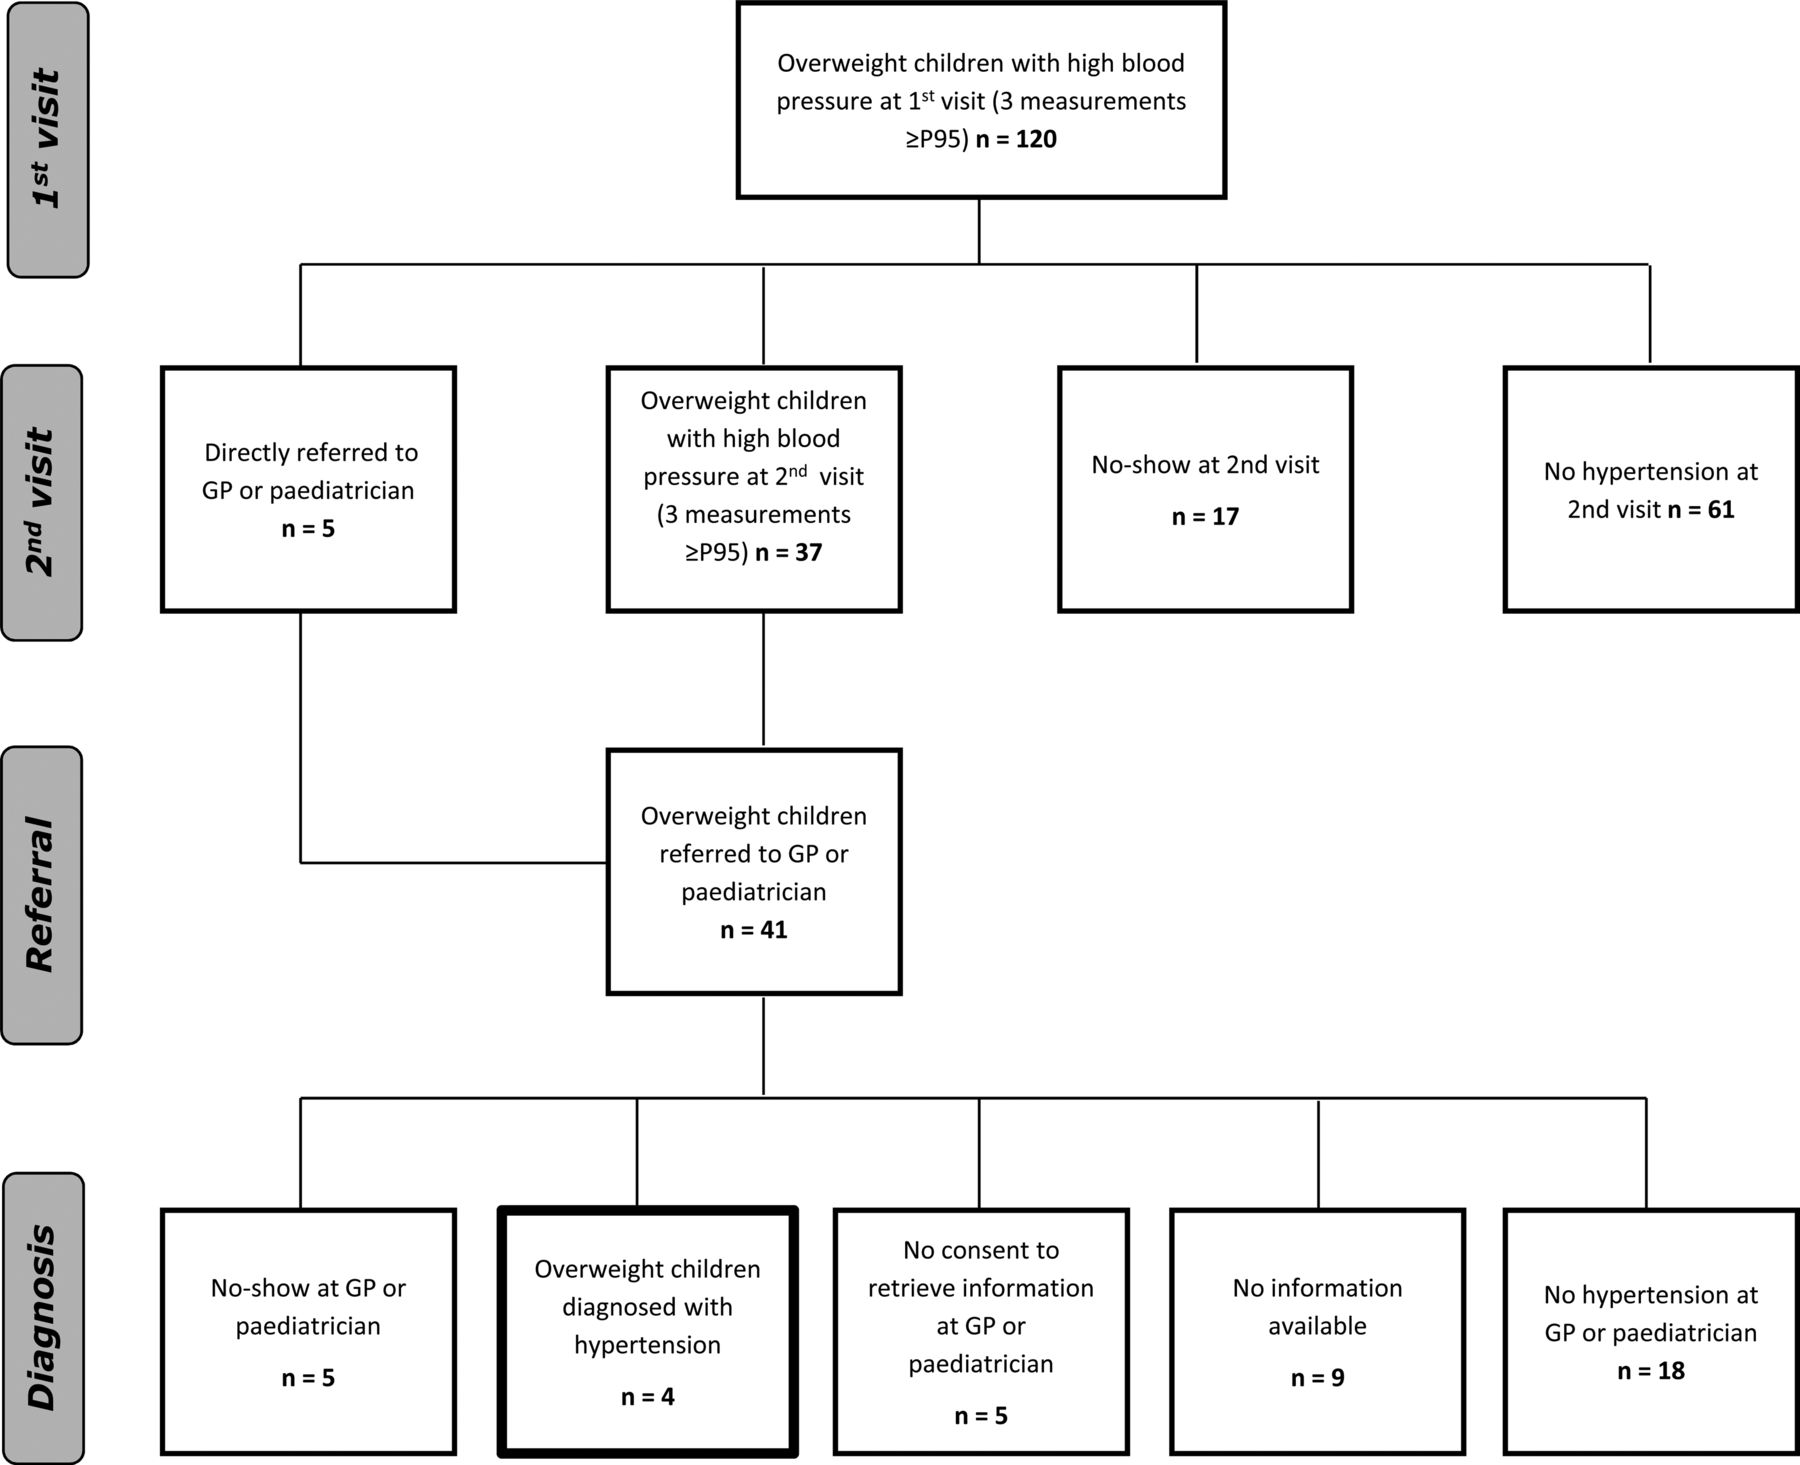
Flowchart of overweight children.
Discussion
Our study underscores the importance of repeated measurements on multiple occasions in order to obtain a realistic impression of the prevalence of hypertension in overweight children. The NHBPEP Working Group recommends measuring BP once, and—if BP values exceed the 90th percentile for age, gender and height—to repeat measurements twice on the same occasion and to compare the average value with the reference values. If BP values exceed the 95th percentile, measurements should be repeated on two different occasions.17 The reference values provided by the NHBPEP Working Group are created based on the pooling of only the first BP measurement values of several cohort studies in children.20 However, many studies into the prevalence of hypertension use different definitions and criteria.
In our sample of 969 overweight and obese children, prevalence of hypertension, after measuring three times on two occasions, was low: 4.4%–6.1%. If other methods were used—examining the first measurement or the mean of two BP measurements at one occasion—the prevalence of hypertension in our sample of overweight children would be, respectively, 32.5% or 28.1%. This discrepancy can be explained by our more strict criteria: (1) Child Health Care professionals in our study performed three consecutive measurements at one visit instead of two measurements, which is common in other studies; (2) the lowest value, instead of the mean, of the three measurements was used for comparison with the 95th percentile cut-off point and (3) a BP≥95th percentile at the first visit needed to be confirmed in a second visit.
We argue that BP should be measured three consecutive times if BP is elevated the first two measurements. Our study shows that the third measurement in a row is most often the lowest value. This is probably because children are often anxious having their BP measured. Consequently, measuring the BP multiple times will result in a lower prevalence of hypertension. In addition, we argue that taking the lowest value is the best approach to obtain the ‘real’ value. This is because BP values can easily increase due to physical activity, stress or anxiety, but BP cannot easily drop below its normal level in a healthy child. Therefore, in clinical practice it is common to use the lowest value instead of the average. The high prevalence in non-overweight children using only the first measurement or the mean of two measurements on one occasion, respectively, 21.2% and 15.8%, might indicate that these methods overestimate the prevalence of hypertension. More research should be done to determine which value is clinically the most relevant and should be compared with the reference values, the average value or the lowest value.
In our study, in the case of elevated BP, children were asked to return for a second visit to measure the BP again three consecutive times, as recommended in Child Health Care. This way, numerous children with a temporary increase in BP due to the excitement of the examination were filtered out and less children are unjustly referred to the general practitioner of paediatrician. The same phenomenon was shown in a study by Sorof et al,2 in which the prevalence of hypertension in overweight and normal weight children dropped from 19% at a first visit, to 9.5% at a second visit, to eventually 4.5% at a third visit.
It is questionable to compare BP data with reference values if both are established in a different manner. It must be noted that the prevalence of hypertension we have found in our study population would have been higher if the reference values would have been established in the same manner, instead of based on the pooling of only first measurements.17 Hence, to draw any conclusions on the prevalence of hypertension, normal values using the same definition of hypertension should be established. In addition, to examine if the prevalence found with our criteria and definition is real, an ambulatory blood pressure monitoring (ABPM) should be performed in all children.
A major strength of this study is the thorough procedure and strict interpretation of the BP measurements, that is, by repeated measurements on two occasions and using the lowest value to compare with reference values. Therefore, we believe this study provides a realistic impression of the prevalence of hypertension in overweight children in the Netherlands.
In our study we used validated oscillometric monitoring devices,21 for practical reasons. An advantage of the use of an oscillometric device is that it is easy to use and it minimises interobserver variation. A disadvantage is that the reference values are based on BP values obtained with a sphygmomanometer. We did not repeat measurements taken with the oscillometric devices with a sphygmomanometer.
Even though Dutch Child Health Care, where all children are regularly invited for a health check-up, is a unique setting, the results of this study are generalisable to other countries.
It must be noted that Child Health Care in the Netherlands is merely responsible for screening and identification of patients and not for diagnosis and treatment, this takes place in the hospital by a paediatrician. Hence, the suggested definitions and criteria for high BP are for screening and identification of children with possible hypertension, and not for formal diagnosis. In the Netherlands, Child Health Care does not perform ABPM. In our study we followed children with an elevated BP at the second visit in Child Health Care to the general practitioner or paediatrician to obtain a formal diagnosis done by ABPM. Unfortunately, due to the high numbers of no-show, for many children we did not receive the formal diagnosis. Ideally, all children with elevated BP at the second visit would have formally been diagnosed by means of ABPM.
As mentioned, an important limitation of our study is the high percentage of no-shows at both the second visit and at the general practitioner or paediatrician (figure 1). Apparently, many parents were not motivated to have their children's BP measured again at the Child Health Care centre, by the GP or paediatrician. This is an important finding and should be a subject for further research. It is important to find out the reason for this lack of motivation, that is, fear, ignorance, so that healthcare workers are able to respond appropriately.
In addition, in this study only the children who had an elevated BP at the first visit were asked to return for a second visit. It would have been interesting to see all screened children for a second visit after 6 weeks, in order to compare the change in BP in between visits between hypertensive and normotensive children.
Conclusion
Our study demonstrates that the prevalence of hypertension is highly dependent on the manner in which BP is measured and interpreted. The prevalence of hypertension in children with overweight or obesity in our study sample, based on the first measurement or the average of two BP measurements on one occasion, was, respectively, 32.5% and 28.1%. However, based on our thorough method and interpretation of the measurements—BP was measured three consecutive times on two occasions, the lowest value was compared with the reference value, as common in clinical practice—the prevalence was 4.4%–6.1%, lower than expected based on international literature.
It is important that overweight children are screened for hypertension, a prevalence of 4.4%–6.1% in overweight children is still clinically relevant, since hypertension can result in cardiovascular morbidity and mortality and tracks into adulthood. However, further research, and agreement, is needed on: (1) how many measurements should be taken at one visit; (2) which value should be compared with the reference values and (3) the reason for the high numbers of no-shows to follow-up measurements. In addition, in order to determine which definitions and criteria generate the most ‘real’ values of BP, the mean of two or the lowest of three measurements, measurements should be repeated with ABPM in all children to compare outcomes.
Acknowledgments
The authors thank the Child Health Care professionals who participated in this study. In addition, the authors thank all children and parents for their participation. The authors are grateful to Omron for providing the oscillometric blood pressure monitors.
References
Footnotes
Contributors AW performed data collection, conducted the statistical analysis of the data and drafted the initial manuscript. JN contributed to the idea and design of the study, revised the text of the manuscript several times. JG contributed to the idea and design of the study, and revised the text of the manuscript. TR contributed to the idea and design of the study. RH contributed to the idea and design of the study, and revised the text of the manuscript. MC supervised the statistical analysis of the data and revised the text of the manuscript several times. JK conceptualised and designed the study, supervised the data collection and data analysis and revised the text of the manuscript several times. All authors approved the final manuscript as submitted and agree to be accountable for all aspects of the work.
Funding This study was funded by the Dutch Kidney Foundation, VR12.03.
Competing interests None declared.
Ethics approval VU University Medical Ethical Committee.
Provenance and peer review Not commissioned; externally peer reviewed.